Article

Portfolio Optimization Considering Behavioral Stocks with Return Scenario Generation

by
Michael N. Young
1,†,
TJ Troy N. Chuahay
2,*,†,
Yen-Hsien Lee
2,†,
John Francis T. Diaz
3,†,
Yogi Tri Prasetyo
1,4,5,†,
Satria Fadil Persada
6,† and
Reny Nadilfatin
7,†
1
School of Industrial Engineering and Engineering Management, Mapua University, Manila 1002, Philippines
2
Department of Finance, Chung Yuan Christian University, Taoyuan City 320, Taiwan
3
Department of Finance and Accounting, Asian Institute of Management, Manila 1229, Philippines
4
International Program in Engineering for Bachelor, Yuan Ze University, Chung-Li 32003, Taiwan
5
Department of Industrial Engineering and Management, Yuan Ze University, Chung-Li 32003, Taiwan
6
Entrepreneurship Business Creation, Business School, Binus University, Jakarta 11480, Indonesia
7
Department of Information Systems, Institut Teknologi Sepuluh Nopember, Surabaya 60111, Indonesia
*
Author to whom correspondence should be addressed.
These authors contributed equally to this work.
Mathematics 2022, 10(22), 4269; https://doi.org/10.3390/math10224269
Submission received: 12 October 2022 / Revised: 2 November 2022 / Accepted: 9 November 2022 / Published: 15 November 2022

Abstract

:
This study extends the application of behavioral portfolio optimization by estimating the return of behavioral stocks (B-stocks). With the cause-and-effect relationships of the respective irrational behaviors on the stock price movements and the unique information provided by B-stocks in terms of knowing with a calculated probability when (time duration) a specific effect (e.g., positive cumulative abnormal return) after a certain trigger point (cause of the irrational behavior) is spotted, regression analysis is applied on the information in the duration to have more accurate return estimates. To fit in the framework of behavioral portfolio optimization, the scenarios used for the optimization are generated utilizing regression analysis, based on which the safety-first scenario-based mixed-integer program is applied to obtain the optimal portfolios. This study also proposes two new types of B-stocks with corresponding operational definitions for herding and ostrich-effect, along with the previously identified over-reaction, under-reaction, and disposition-effect B-stocks. Back-test results show that the portfolios are profitable and can significantly outperform a benchmark and the market.
MSC:
90-10; 91-10
JEL Classification:
G11; G17

1. Introduction

Portfolio selection has been a popular topic since the introduction of modern portfolio theory or the mean-variance theory (MVT) [1] of the Nobel prize winner economist Harry Markowitz. MVT states that investors rationally select portfolios based on risk-return trade-offs such that given investments of similar risks (returns), investors will always prefer the investment with the highest return (smallest risk) over the given choices. However, it is argued that many investors have their personal preferences or bias, leading to the emergence of behavioral finance and behavioral portfolio theory (BPT) [2]. Individual perception plays a huge role in BPT. BPT asserts that behavioral investors frame investments into different mental accounts (MAs) corresponding to the risk and return objectives. BPT investors use a safety-first portfolio selection model in selecting their portfolio based on their tolerance of loss and the corresponding probability. When we look at future returns, investors, based on their perception, provide estimates on future performances of the market and the underlying securities within it. SP/A theory of [3] claims that individuals give probability weights on scenarios based on their fear and hope levels. Individuals give more weight to bad (good) scenarios when they are in fear (hopeful). When selecting the security, it is assumed that investors are always looking for securities with higher return rates or lower risks. However, the investor may sell the security with an increasing return rate because they are afraid of the future drop in the price; they may withhold the security with decreasing rates because they think the price eventually will return to what it was. The potential collective influence of irrational behaviors may stimulate stock prices and likely cause price distortions. These studies led to the framework of behavioral portfolio optimization.
The behavioral portfolio optimization framework comprises 3 parts, return estimation, return weighting, and mental accounts (MAs) selection. In the return estimation phase, an investor will have an estimate of the future performances of the considered investment pool. Then, the investor would assign corresponding probabilities of the estimated returns. Subsequently, the investor would then use the appropriate portfolio selection model to get the optimal portfolio for each of his/her MA. Again each mental account corresponds to a specific goal (returns) and risk level [4]. Behavioral portfolio models incorporate behavioral biases in investing considering different or multiple return objectives intended for family, retirement savings, emergency funds, etc. [5]. Moreover, ref. [6] stated that behavioral portfolio management or BPM is the superior way to make investment decisions. The main concept in BPM is that investors tend to be emotional, which can affect the price movement. Knowing this effect, superior portfolios can be built by studying the irrational behaviors of investors and seeing how they affect the price movement. There are many studies like [7,8,9,10,11] providing proof that irrational behavior exists among investors. Still, there are limited studies that show how these irrational behaviors can be exploited to have a superior portfolio. There are several irrational behaviors among investors, but in this study, 5 irrational behaviors are considered in generating superior portfolios. The first bias considered is the Disposition effect.
The disposition effect (DE) may be observed when investors, for some irrational reason, sell winning stocks too early and hold on to losing stocks too long. It can be placed into a broader theoretical framework that the aforementioned is the general disposition of all investors [12]. In this framework, the investor is more concerned with avoiding loss than realizing gain; this happens when the investor has not yet moved on from the pain of losing previous investments [8]. DE happens when investors consider investments on a loss or gain perspective rather than the final wealth levels [7]. The second irrational behavior examined is overreaction among investors.
Over-reaction (OR) is the irrational behavior of investors to overreact to recent positive or negative news. An earlier study on OR done by [9] analyzed the abnormal returns of winner (portfolios that are profiting) and loser (portfolios that are losing) portfolios and observed performance reversals. Following this study, ref. [13] showed the existence of OR through the identification of seasonal patterns of returns showing that past losers significantly outperform past winners. It was observed by [10] that loser portfolios dominate winner portfolios after 4 years using data from the Tokyo stock exchange. Similarly, ref. [14], in 1 week, spotted return reversals after sudden large price changes. In a study of the Hong Kong market considering the pre and post-Asian financial crisis by [15], they observed statistically significant patterns of price reversals 2 days after a substantial price change. Using Nasdaq and NYSE data, ref. [16] also identified significant reversals after a large price change for Nasdaq (1–2 days) but not for NYSE. Studying exchange-traded funds (ETFs), ref. [17] also encountered pronounce price corrections (or reversals) after extreme price changes. If there is over-reaction, then we also have under-reaction among investors.
Under-reaction (UR) is the irrational behavior of investors to under-react to recent positive or negative news. The concept of UR is the opposite of over-reaction. According to [18], under-reaction (over-reaction) is observed in unstable (stable) markets with precise (noisy) signals. Earlier works of [11,19,20,21,22] show evidence wherein the market response to significant new information seems to be too late or too little. Moreover, refs. [19,20] provided evidence that financial analysts under-react to the announcement of earnings such that they over-estimate (under-estimate) quarterly earnings after positive (negative) surprises. It was also observed by [11] that price responses to dividend cuts and or initiations tend to continue for an extreme and irrational long period. Usually, UR is studied together with OR. Intuitively, if in OR the focus is the price reversal after a significant large price movement, then for UR, continuous performance with the same direction is expected. Another irrational behavior prevalent among investors is the ostrich effect.
The term “ostrich effect” has been used in studies of financial decision-making, where it signifies investors’ willingness to “avoid risky financial situations by pretending that they do not exist”. Ref. [23] states that it is the avoidance of apparently risky financial situations by pretending they do not exist. Ostrich Effect (OE) is the irrational behavior of investors to avoid unfavorable information about their portfolio. It is the behavior of avoiding exposing oneself to [financial] information that one fear may cause psychological discomfort. For example, in a market downturn, people may avoid monitoring their investments or seeking other financial news [24]. Monitoring one’s current standing concerning goals can promote effective self-regulation. However, the present review suggests that there is an ostrich problem such that, in many instances, people tend to “bury their head in the sand” and intentionally avoid or reject information that would help them to monitor their goal progress [25]. In OE, people would rather move away from disturbing situations, which seem difficult, frightening, and even dangerous [26]. An individual prefers not to obtain information about her state of affairs because of the fear that she may receive bad news, despite the prospect of making better decisions based on this information [27]. Lastly, we have the herding bias among investors.
Herding is the bias wherein a large group of individuals is doing the same investment action. Herding behavior is also defined by [28] as “everyone doing what everyone else is doing, even when their private information suggests doing something quite different.”. The work of [29] pointed out that in its most general form, herding could be defined as behavior patterns correlated across individuals. Still, such behavior patterns could be due to correlated information arrival in independently acting individuals. The type of herding behavior most interesting to researchers and widely studied in stock trading and online auctions, as in [30], is caused by informational cascades. Informational cascades occur “when it is optimal for an individual, having observed the actions of those ahead of him, to follow the behavior of the preceding individual without regard to his information” [31]. In other related works by [32,33,34] and many other researchers define herding as following others’ decisions and using stock returns to test the existence of herd behavior.
Considering all these irrational behaviors, the question is how we exploit them to generate superior portfolios, as BPM implied. As mentioned, most related literature just tries to identify the existence of these biases. Still, there are limited studies on how these irrational behaviors can be utilized to generate optimal portfolios. To the authors’ knowledge, only the proposed behavioral stock portfolio optimization proposed by [35,36,37,38,39] deals with the identification of the cause-and-effect relationship of a collective investor behavior with a stock price movement. It then exploits the information to generate superior portfolios. They call the stocks with a significant cause-and-effect relationship with an investor bias and price movement behavioral stocks or B-stocks.
B-stocks are defined by identifying the cause (trigger point) and effect (e.g., cumulative abnormal return becomes positive) relationships or patterns between a collective irrational behavior of investors and a stock price movement. Moreover, the corresponding likelihood of occurrence (PBs) and time duration (T-days) between the cause and effect are also tested and known. Because we can identify the cause-effect pattern of B-stocks, it makes B-stocks predictable and can be considered a good investment pool in portfolio selection. In general, a B-stock contains the information of a cause-effect-PB-T pattern. From the operational definitions (ODs) of irrational behavior available in related literature, we can identify the cause-and-effect relationship between a stock’s price movement and the effect of the tested behavior. For example, a large price change can represent the cause of the behavior, and a follow-up price reversal can be the ensuing effect. It is also essential to know when the effect will occur after a cause is spotted and the probability that the effect will occur after the said time duration. This is done by looking at the historical data and counting the occurrence of the expected effect after possible causes. Then, using a statistical test, we can verify whether the proportion of occurrence with the possible causes is more than a threshold probability. Those stocks that show a significant cause-and-effect pattern with the corresponding T-days and P B are then considered into the B-stock big pool. Depending on the investment strategy, this big pool can be further screened into smaller pools. Since it is known when the effect will occur, one strategy is to invest 1 day before the effect day or during (T − 1)th day. Another strategy is to invest immediately after spotting the cause and exit on the effect day or T-day. For the 1st strategy, the investment pool (small pool 1) are those B-stocks in the big pool that are already on their (T − 1)th on a given trading day. Similarly, for the 2nd strategy, the investment pool (small pool 2) are those B-stocks in the big pool that have their causes spotted on a given trading day. The unique information embedded within these B-stocks is then exploited to have superior portfolios as done by these 5 studies [35,36,37,38,39].
The initial idea of B-stocks was first introduced by [35]. The study considered two irrational behaviors (over-reaction and under-reaction) in identifying significant cause-effect-PB-T patterns. They exploit the over-reaction and under-reaction B-stocks by considering the small pool 1 investment pool and long position (buy-hold-sell) investment strategy. Regarding return estimation, historical returns were used as return estimates and scenarios. With the assignment of probability weights, SP/A (security, potential, and aspiration) theory is applied to give corresponding probabilities to the return scenarios. The study also proposed the initial concept of a two-dimensional probability weighting which considers the scenarios weights and also the PB weights of individual B-stocks. This 2-D weighting mechanism was embedded into the generic safety-first scenario-based portfolio selection model to generate the optimal portfolio. The model ensures that scenario weights and the likelihood of each B-stock realizing the expected effect or PB are consistent with their respective probabilities such that the optimal portfolio will have the highest combined PB. Then through back-testing, their results show that this framework can outperform benchmarks (e.g., mean-variance portfolio) and the market. The study only considers small pool 1, so the question now can small pool 2 also generate superior portfolios?
The next study [36] on behavioral stocks answers whether small pool 2 can also generate superior portfolios. The study considered two irrational behaviors, which are over-reaction and disposition effect. The main difference from the previous study is that this study now exploits B-stocks using small pool 2 instead of small pool 1. A long position is still the investment strategy, but this time the holding period of a B-stock now depends on its T-day. Regarding return estimation and assignment of probability weights, historical returns are still used as the estimate for future performances, and these estimates are assigned weights based on SP/A theory. The PBs of B-stocks are now considered for screening further the investment pool (small pool 2) to ensure a P B T efficient portfolio. A P B T efficient portfolio only considers a B-stock in the portfolio if and only if its P B is at least higher than the minimum probability (set by the investor) at a given T-day. As for the selection model, a modified scenario-based safety-first model was applied to generate the optimal portfolios. Now, the model’s objective is to have the highest cumulative return over the respective T-days of each B-stock considered in the portfolio. Back-test results show that the proposed behavioral stock portfolio selection framework can also outperform benchmarks (e.g mean-variance portfolio) and the market. The first two studies consider a long position as the investment strategy, so the question is, can B-stocks be profitable using a short position investment strategy?
The succeeding study [37] on behavioral stocks answers the question of whether a short position investment strategy can be applied to B-stocks. The study considered two irrational behaviors, which are over-reaction and disposition effect. The authors considered investment pool 2 and the short position (short-wait-buy-back) investment strategy. To make a profit in a short position investment, the shorted asset or stock should decrease in price such that you take profit when you buy back the asset. Therefore, the considered B-stocks should have the expected effect of negative returns so that when shorted, they will provide profit to the investor. These B-stocks are coined as short-sell B-stocks to differentiate from B-stocks whose expected effect are positive returns. Regarding return estimation and assignment of probability weights, historical returns are still considered as the return estimate for future performance and assumed to be equally likely. In terms of the portfolio selection model, a modified scenario-based safety-first model was applied to obtain the optimal portfolios. They modified the objective function to minimize the return rate of stock bought, which maximizes the profit for short-selling those same B-stocks. The resulting portfolios from the back-test show that they can also outperform the market. At this point, studies on B-stocks only considered the paper returns of the portfolio, so how will the B-stocks perform in a more sensible investment wherein portfolio re-balancing and actual trading costs are considered?
To make B-stocks a more realistic venture and utilizing small pool 2, ref. [38] presented an aggregate portfolio selection model that considers both a long position and short position investment strategy on B-stocks & short-sell B-stocks while also considering actual trading costs. The aggregate model is a portfolio re-balancing model based on the scenario-based safety-first portfolio selection model. Still, the objective function is now modified to cater to the maximization of the returns of the buy & sell of B-stocks and short & close of short-sell B-stocks. Since each B-stocks have different T-days, the resulting portfolio returns would not fall on a consistent time interval. It would be difficult to compare them to benchmark portfolios. Hence they provided a solution on how to compare the portfolio performances. Appropriately, the resulting portfolios also show that the portfolios with B-stocks and/or short-sell B-stocks can outperform traditional benchmarks even on actual trading conditions. The study still used over-reaction and disposition effect B-stocks in the back-test. Return scenarios were still estimated using historical returns, and the corresponding probabilities of each scenario were assigned using SP/A theory. The last 3 studies [36,37,38] work on exploiting B-stocks in small pool 2, so what is next for B-stocks in small pool 1 as utilized by [35]?
Another way of exploiting over-reaction and disposition effect B-stocks in small pool 1 was done by [39], which improves upon the initial work of [35]. They polished the proposed two-dimensional weightings and embedded it on a modified safety-first portfolio selection model wherein the portfolio chosen will satisfy not only the return scenarios but also the respective likelihood-to-effect or PBs of each B-stock considered. They also considered the different risk attitudes of investors and changed the scenarios’ respective weights through SP/A theory to represent all types of investors during the back-test. Their work provides evidence that these B-stocks can be exploited to generate superior portfolios which can outperform benchmarks and possibly be a viable alternative investment option for investors. In terms of return estimation, the study, similar to the previous 4 studies [35,36,37,38] on B-stocks, only considered historical returns as an estimate for future performances. Thus, the question now is, “What if we can estimate also estimate the returns on the Tth day?”.
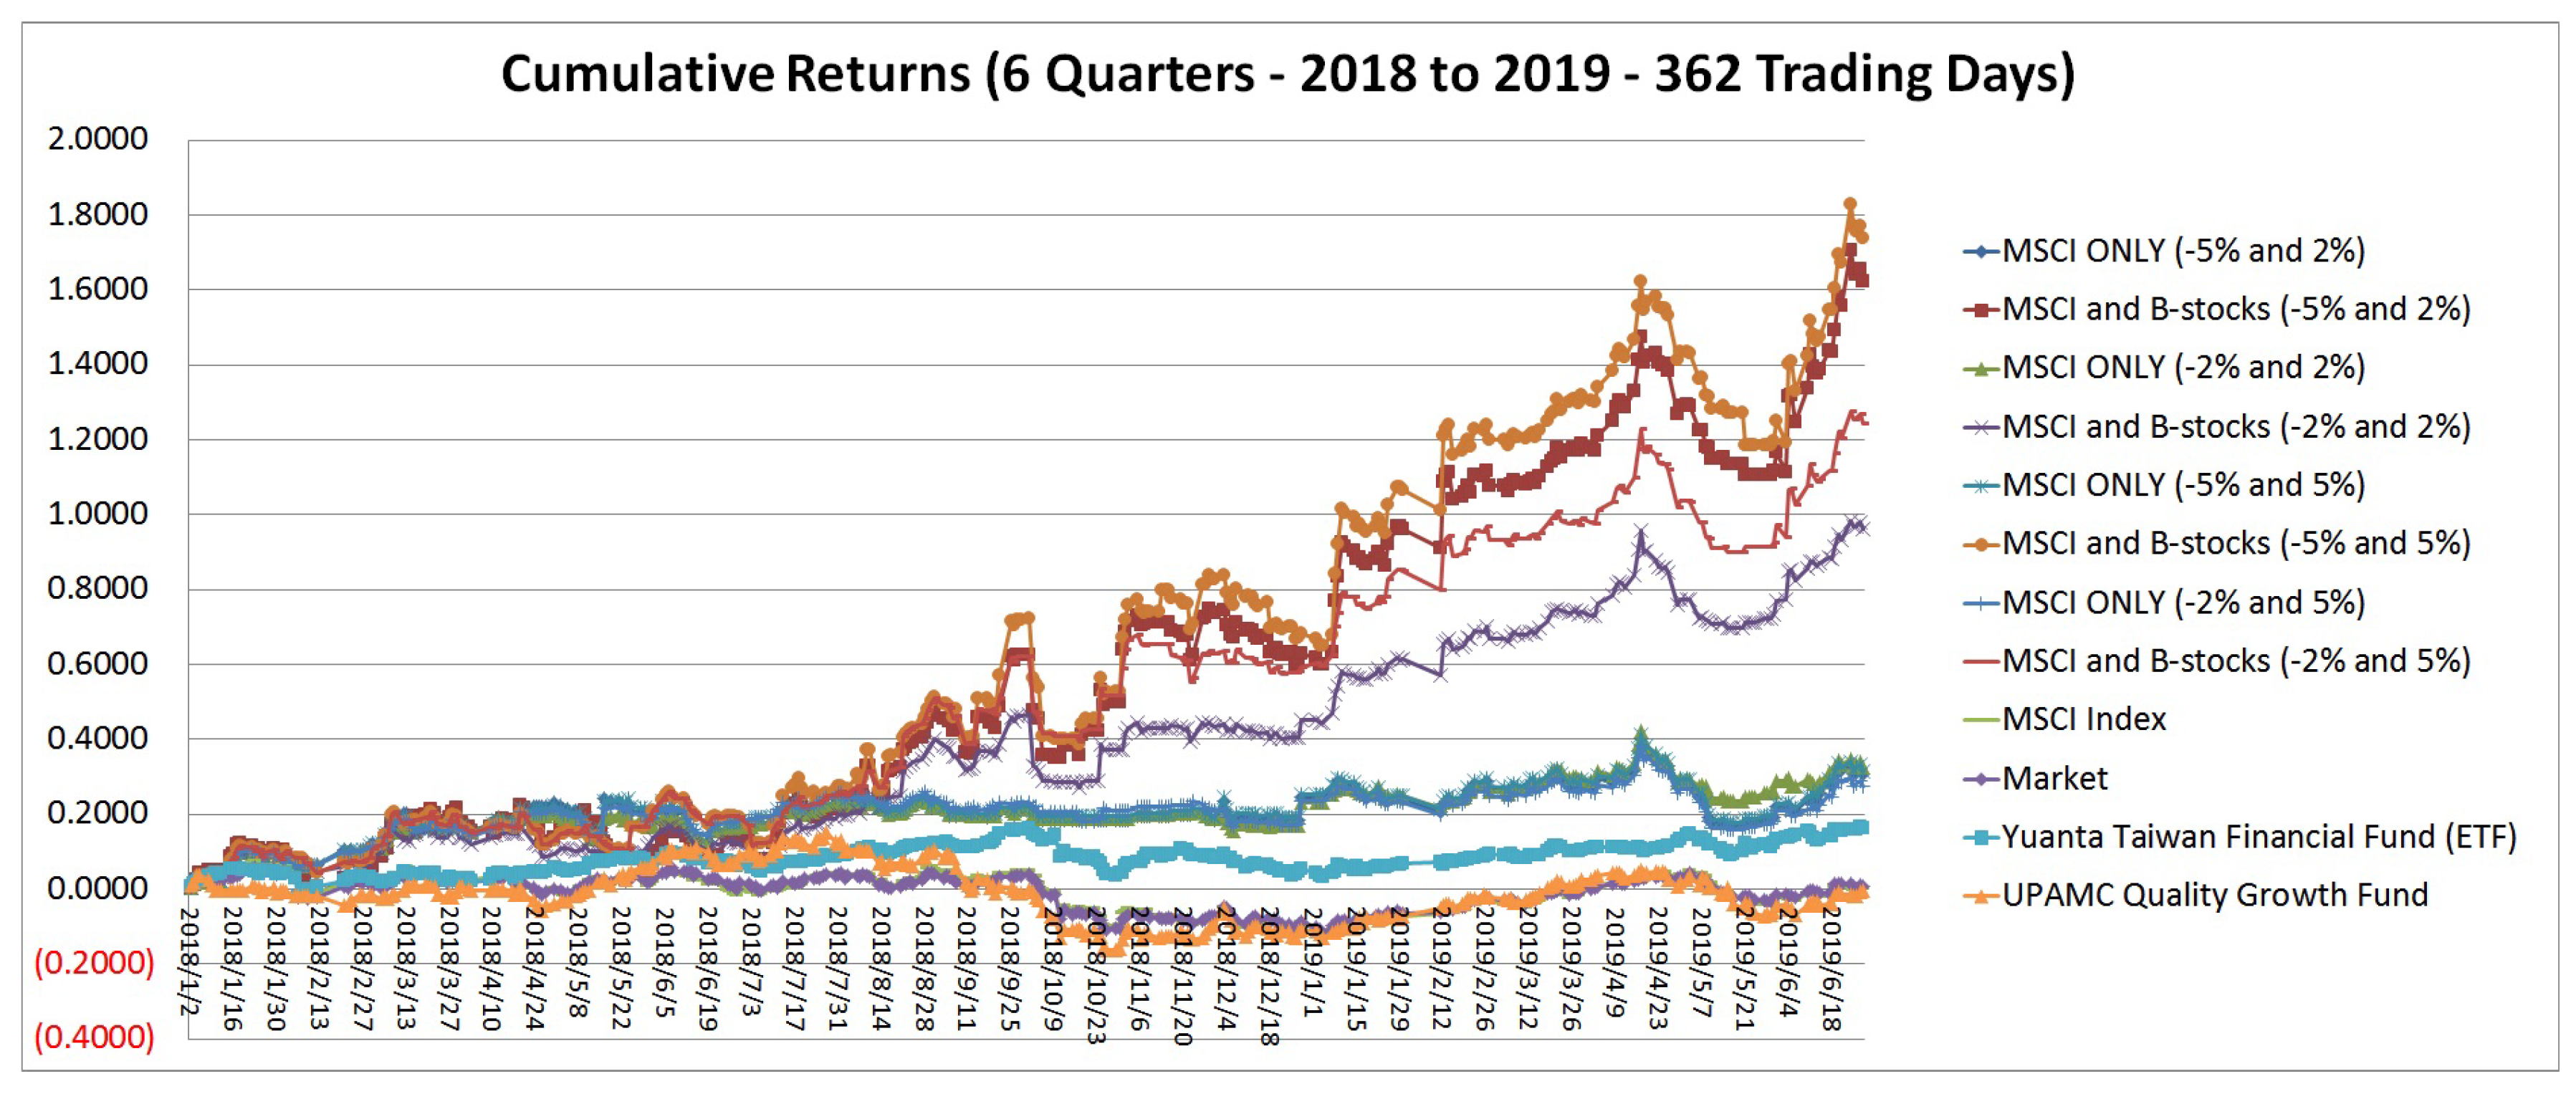
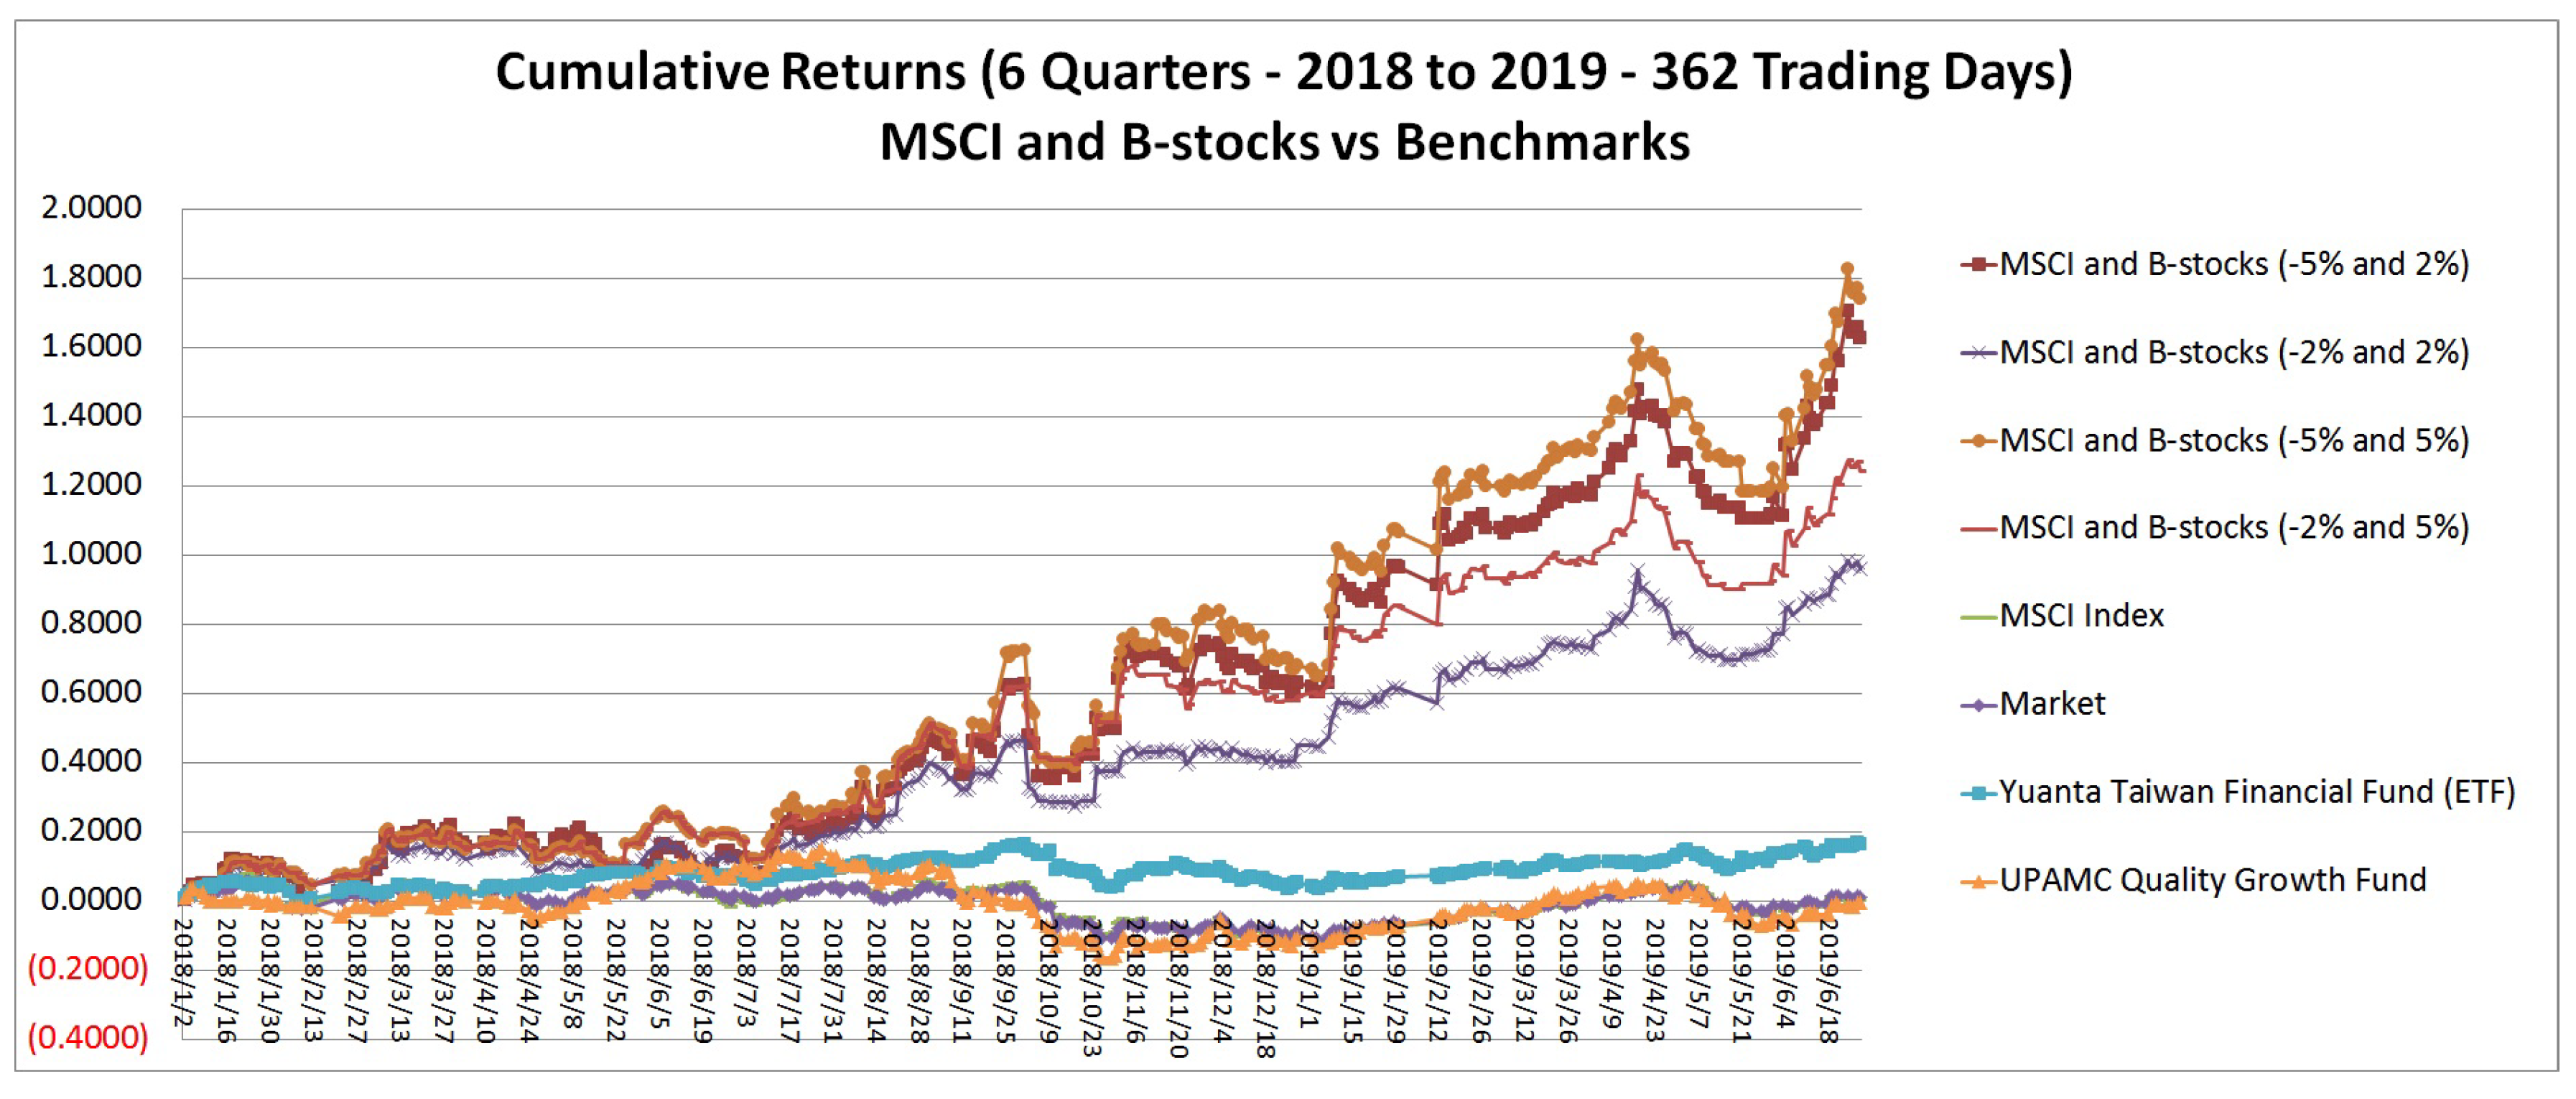
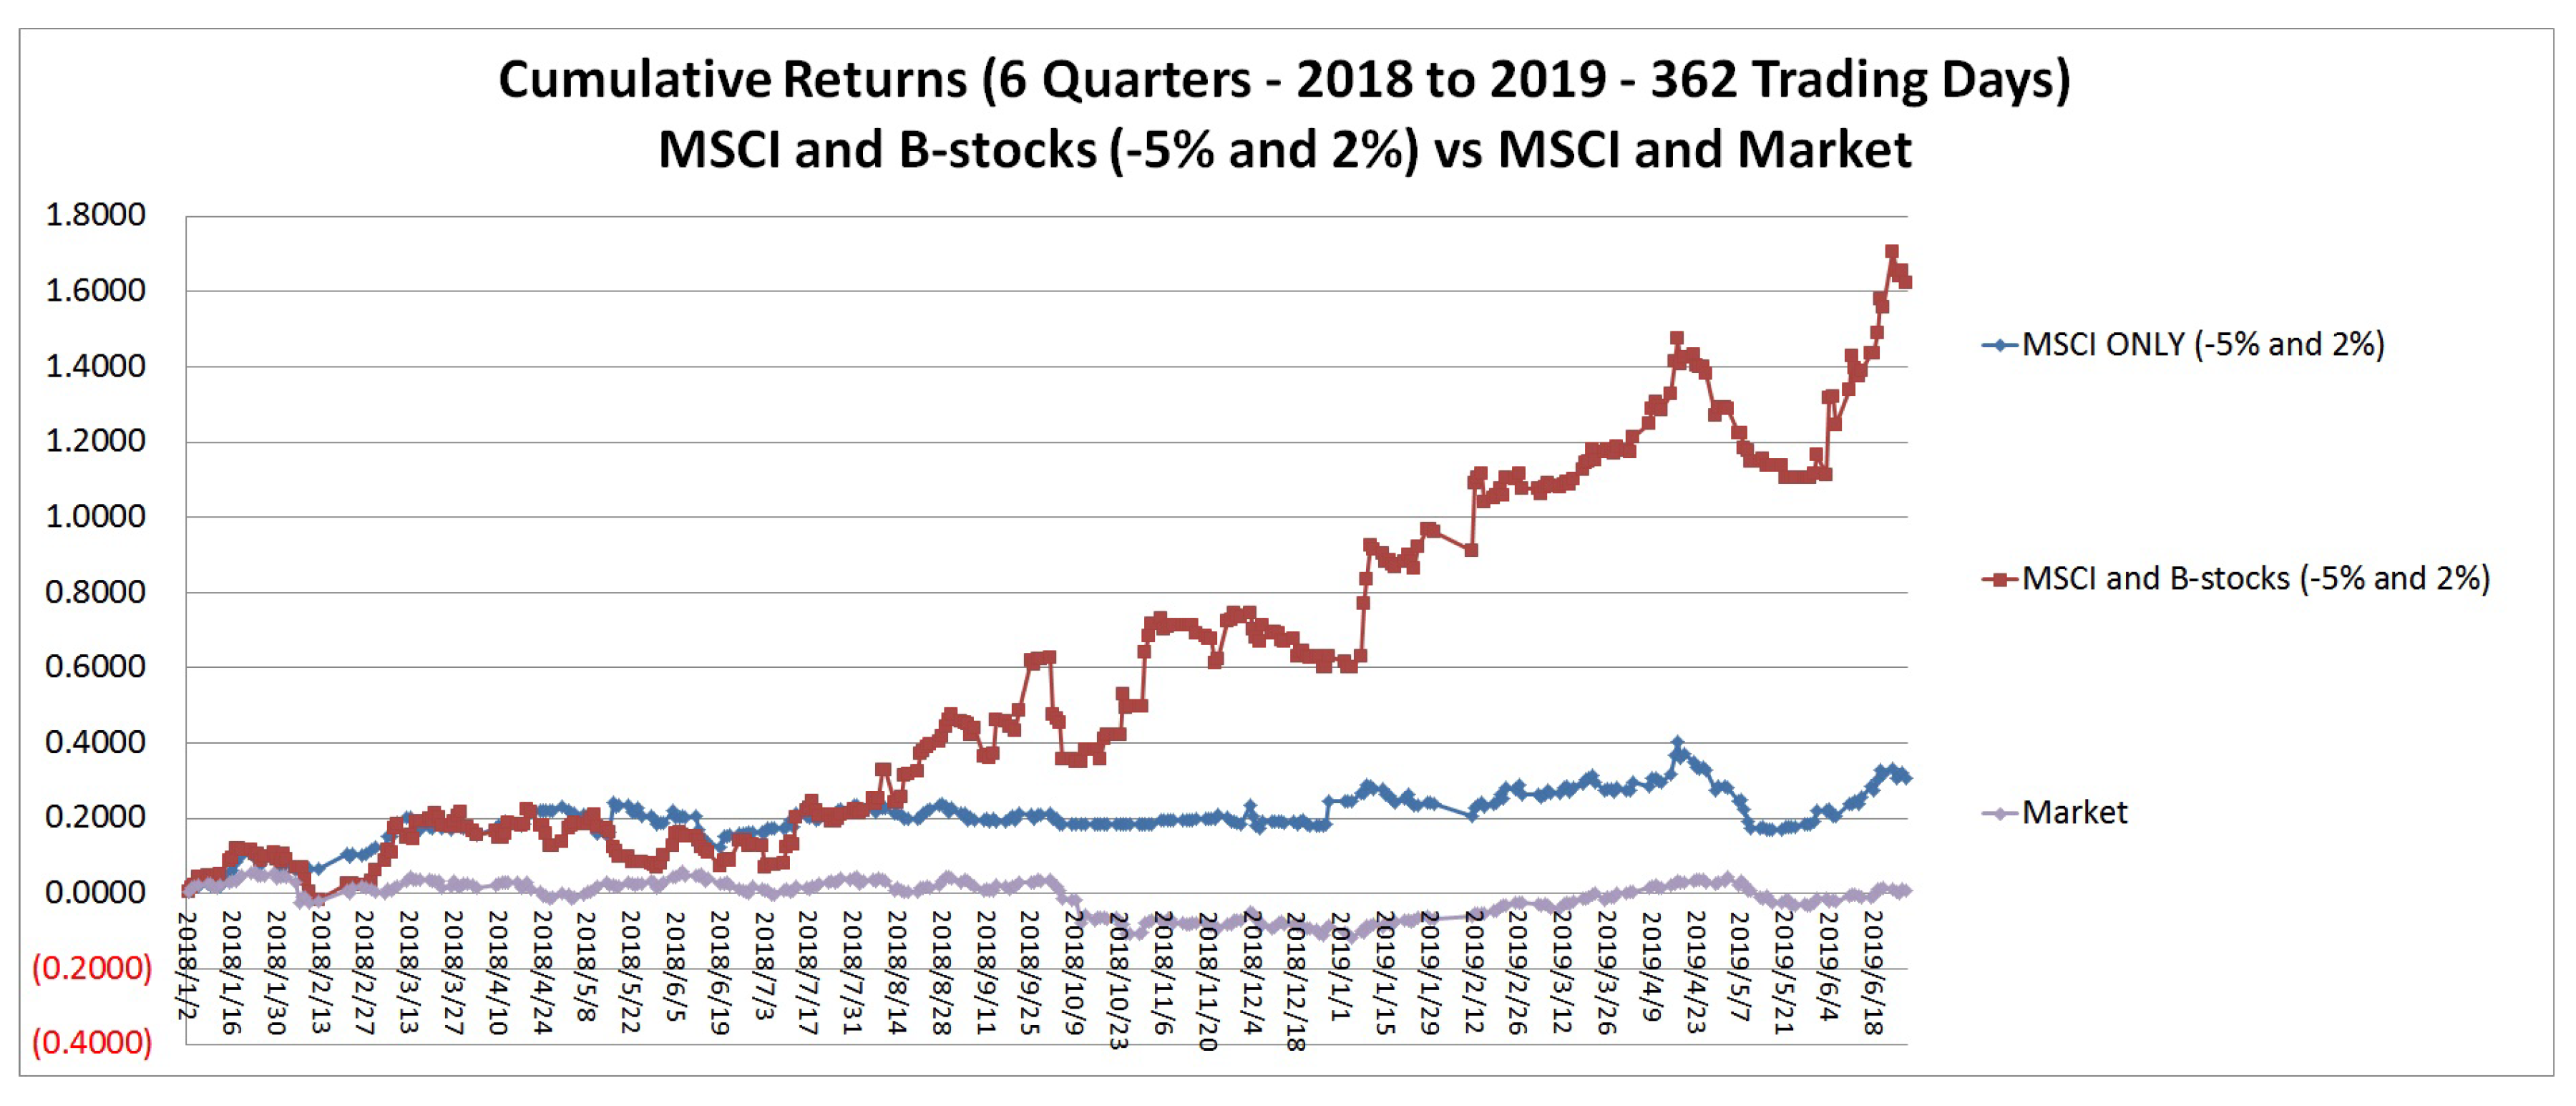
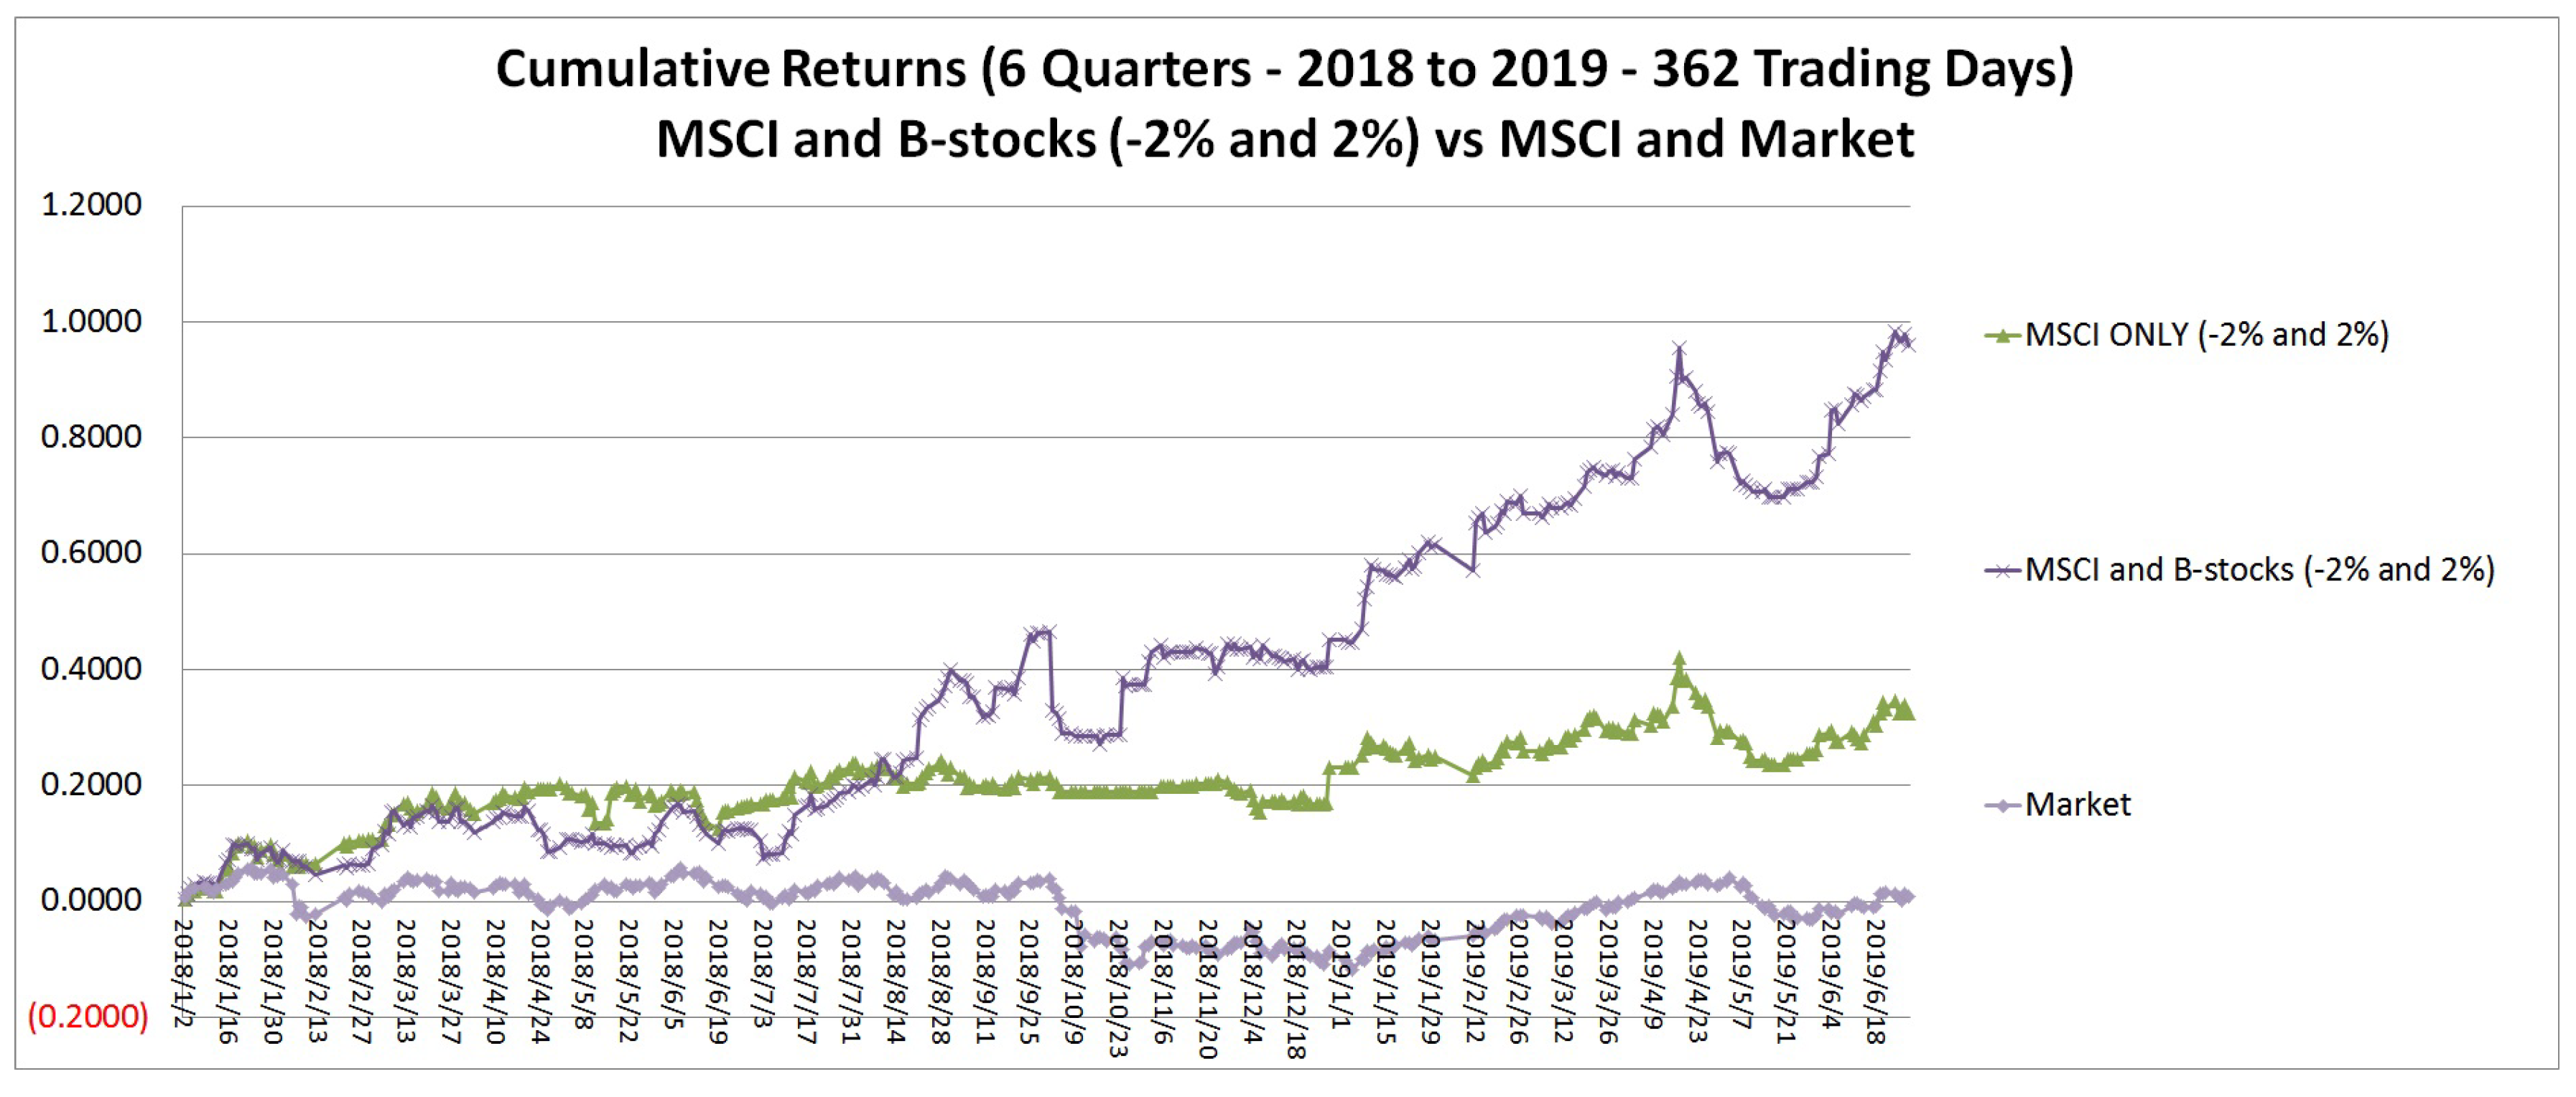
This study addresses the question if we can improve the studies on B-stocks by actually estimating the returns of B-stocks on its Tth day. The current work proposes a behavioral stock portfolio selection framework wherein the respective T-day returns of B-stocks are estimated through regression analysis. For each B-stock, we empirically establish regression functions for the return on the effect day through the market’s and its past T 1 days return. By relating all the B-stocks to the market, we can correlate them. Based on the corresponding system of regression functions, we can have the return scenarios for the next period (e.g., tomorrow) by fitting in available information about the returns of the B-stock over the T 1 days observed during the test period (e.g., today). Thus, generating the realizations of the market and individual B-stock returns. This study also expands the types of behavioral stocks wherein disposition effect, over-reaction, under-reaction, ostrich effect, and herding B-stocks are now considered in generating a superior portfolio.
This paper is presented as follows. Section 1 discusses the intro and related literature on modern portfolio theory, behavioral portfolio theory, the framework of behavioral portfolio optimization, irrational behaviors, and behavioral stocks & related studies. Section 2 defines the proposed operational definitions, how scenarios are generated, and the portfolio selection model. Section 3 provides an analysis of portfolio performances. Section 4 states the concluding remarks of the work. Acknowledgment gives credit to the funding body that supported the study. Lastly, the Appendix A include relevant attachments for the study.

2. Methodology

This study presents an alternative variation of the basic framework of portfolio selection wherein the focus is on providing a better method of estimating future returns. Better return estimates logically will lead to superior portfolios. Thus, with the unique information provided by B-stocks of knowing the cause-and-effect relationship between the behavior and stock price movement, the T-days or the time duration for the effect to occur after the cause has been spotted, and the P B or the likelihood that this pattern holds true, one can have a better estimate on future performances of these stocks. Therefore, this section summarized the ODs of the 5 types of B-stocks considered, the regression analysis applied to estimate the returns, and the portfolio selection model used to obtain the optimal portfolios.

2.1. Operational Definitions and Identifying B-Stocks

2.1.1. Disposition Effect OD

As defined by [35,36,37,38,39], the OD for disposition effect (DE) B-stock is that DE winners (stocks that have high average abnormal volume and large positive geometric return for 30 trading days, wherein +10% was used as the minimum value) will be followed by a significant negative cumulative abnormal return (a minimum drop of −1%). Similarly, DE losers (stocks that have low average abnormal volume and large negative geometric returns for 30 trading days, wherein −10% was used as the minimum loss) will be followed by a significant positive cumulative abnormal return (minimum return of 1%). The reasoning for this is that when a DE winner (loser) is identified, investors tend to capitalize on gains immediately (tend to avoid loss by opting not to sell) such that it depreciate (appreciate) the stock’s price temporarily, then from this price lower (upper) baseline subsequent prices will go up (down) again.

2.1.2. Over-Reaction OD

Related literature shows that over-reaction (OR) is observed when there is a sudden large price change which is subsequently followed by price reversals. On a clearer definition, ref. [17] defines it best as “a large positive (negative) price change which is subsequently followed by a high negative (positive) cumulative abnormal return or CAR”, this OD is later on followed by the studies of [35,36,37,38,39]. The reasoning for this is that when investors overreact to information it will derail the performance of winners and losers causing performance reversals.

2.1.3. Under-Reaction OD

In contrast with OR, ref. [17] states that under-reaction (UR) is observed when “Positive (negative) CAR is following a large positive (negative) price movement”. The reasoning for this is that when investors under-react to information the trajectory of the performance of winners and losers is not affected due to no actions from the investors. Analyzing the cause-and-effect relationship of under-reaction with a stock price movement, if investors under-react, then the expected effect can be that there will be no reversal and that the current direction of the price will hold for a certain period of time (T-days) after the cause. Investors who under-react receive the same news (sudden high price change) as those who over-react so the same cause can be considered for under-reaction B-stocks or short-sell B-stocks. Therefore, it can be concluded that the OD for UR is “a high positive (negative) price change followed by a high positive (negative) cumulative abnormal return.

2.1.4. Ostrich Effect OD

The Ostrich effect (OE) is the tendency of individuals to avoid and completely disregard certain information (usually information that is harmful to them) until there is some change beneficial or good for them. This is perfectly described by [40] that investors are sticking their heads in the metaphorical sand of ignorance, as an ostrich would do too in a dangerous situation. Ostrich effect investors will completely disregard bad information and will not look at their portfolio until good information arises. Let’s take bad information as the cause and wait for good information as the effect. For a buy-and-sell investor, bad information in investment corresponds to a huge price drop, the wait corresponds to no trading action therefore negatively affecting trading volume, and the good information corresponds to a reversal where these ostrich investors will take action again, therefore, affecting the trading volume. As for short-sell investors, the reverse logic applies. Thus, the proposed OD for ostrich effect B-stocks is defined as ”a high positive (negative) price change with high (low) abnormal trading volume followed by a price reversal with low (high) abnormal trading volume.

2.1.5. Herding OD

Herding investors sink or swim with the herd. Thus, the cause-and-effect relationship between the herding behavior and stock price movement can be summarized as an observed herd or group of investors doing the same action (cause) and then having ± abnormal returns (effect). One can study the trading volume to check for significant high trading volume to identify possible herds then check the resulting effect on the stock price movement (through the cumulative abnormal returns) after some time period. There might be some other interpretation of the cause-and-effect relationship between behavior and stock price movement, but for this study, we stick with the previous statement. Thus, the OD for H B-stock is that a herd of investors (a stock with a high average abnormal trading volume) will be followed by either a positive (profit) or negative (loss) cumulative abnormal return. The reasoning for this is that the high average abnormal trading volume can indicate a formation of an investment herd, then the profit or loss after some time will be the resulting effect.

2.1.6. ODs Summary

Aside from disposition effect (DE), over-reaction (OR), and under-reaction (UR) B-stocks considered by the initial studies on B-stocks, this study presents 2 other biases (ostrich effect (OE), and herding bias (H)) to have more types of B-stocks and short-sell B-stocks. The respective causes and expected effects for the proposed and previous types of B-stocks are listed in Table 1.
The operational definitions of the 5 types of B-stocks are as follows:
  • Disposition Effect B-stock—a high positive (negative) geometric price change with high (low) abnormal trading volume followed by a high negative (positive) cumulative abnormal return.
  • Over-Reaction B-stock—a high positive (negative) price change followed by a high negative (positive) cumulative abnormal return.
  • Under-Reaction B-stock—a high positive (negative) price change followed by a high positive (negative) cumulative abnormal return.
  • Ostrich Effect B-stock—a high positive (negative) geometric price change with high (low) abnormal trading volume followed by a high negative (positive) cumulative abnormal return with low (high) abnormal trading volume
  • Herding B-stock—an abnormally high trading volume followed by a positive or negative cumulative abnormal return.

2.1.7. Identification of B-Stocks

After identifying the respective cause-and-effect patterns for each behavior (over-reaction, under-reaction, disposition effect, ostrich effect, and herding), the identification of B-stocks and short-sell B-stocks can now be made through hypothesis testing to individually test stocks. Similar to [35,36,37,38,39], considering each cause-and-effect pattern and non-overlapping data, the number of times that the expected effect occurs after the identification of causes throughout the historical data is counted to determine the proportion of time or probability that the expected effect will occur after identification of a cause. Then, a one-proportion test is applied to this probability to determine whether the likelihood of the pattern is significantly larger than a threshold probability (e.g., larger than the probability of a fair coin landing head/tail, which is 50%). Let’s denote P i B as the observed proportion of the pattern for stock i and the threshold probability as p. Therefore, the null ( H o ) and alternative ( H a ) hypothesis of the one-proportion test are as follows: H o as P i B p and H a as P i B > p . This test is performed 20 times for each stock i considering T-days from 1 to 20. The smallest or shortest significant T-days from 1 to 20 will be the utilized T-days. Those stocks with significant cause-effect— P i B T -days patterns are considered B-stocks (short-sell B-stocks). The identified B-stocks (short-sell B-stocks) are added to the big pool (initial investment pool). From this big pool, at a given portfolio selection day, B-stocks whose effects are expected to occur the following trading period (day) are added to the small pool. For testing purposes, only those B-stocks (those with expected positive CARs) are considered in the study. Note that on a given trading day, if 1 particular stock is qualified to be in the small pool with 2 or more types of B-stocks or short-sell B-stocks, the type of B-stock wherein the stock has the higher P B value will be chosen. The small pool mentioned here is the same as small pool 1 utilized by the studies of [35,38]. This small pool is the investment pool considered for the back-tests.

2.2. Estimating Returns of B-Stocks

The first part of any portfolio selection framework is to have an estimate of the future performances of the investment pool. Since we have the investment pool, which is the identified small pool. The next step is to have the return estimates. Studies on B-stocks have always used historical returns as estimates for future performances. Estimating the Tth day return of a B-stock has yet to be considered. Thus, this study proposes a familiar technique to have an accurate estimate of the future performances of a B-stock and then generate the appropriate return scenarios through regression analysis.
For a B-stock with the defined cause and T, let R E f f e c t be the return rate on the effect day, which is the Tth day after the cause day. To generate a better estimate of R E f f e c t instead of using the historical data, we should consider utilizing the information embedded in the period of the T 1 days after the cause day and before the effect day. Let R j be the return of this B-stock at the jth day ahead of the effect day, j = 1 , 2 , , T 1 . Let R M be the return of the market on the effect day. In this project, we link the information during the cause-to-effect period to R E f f e c t by obtaining the following regression equation
R E f f e c t = β 0 + β 1 R 1 + β 2 R 2 + . . . + β T 1 R T 1 + β T R M + ε
The coefficients ( β j ) in Equation (1) are obtained through regression analysis on the historical data having the T days cause-effect pattern. β j is the respective coefficient of R j where j = 1 , 2 , , T 1 . β 0 is the intercept of the regression equation. ε is the error term normally distributed with a mean equal to zero and variance σ 2 , which is observed from the ANOVA table. This is a straightforward extension from the popular single-index model: R E f f e c t = α + β R M + ε .
Let T i , R i , E f f e c t , β i , j , t = 1 , 2 , . . . , T i respectively be the Tth day, return on the effect day, and return coefficient of jth day for B-stock i, and
R i , E f f e c t = β i , 0 + β i , 1 R i , 1 + β i , 2 R i , 2 + . . . + β i , T i 1 R i , T i 1 + β T i R M + ε i
where ε i is normally distributed with mean zero and variance σ i 2 . If we have K B-stocks in our small pool, the realizations of ( R 1 , E f f e c t , R 2 , E f f e c t , . . . , R K , E f f e c t ) generated scenarios and R 1 , E f f e c t , R 2 , E f f e c t , . . . , R K , E f f e c t are correlated by the same R M . We estimate R M using exponential weighted moving average and with variance σ M 2 .
Let β ^ i , j be the estimated coefficient of β i , j , j = 0 , 1 , . . . , T i . Then, when investing, if tomorrow is the effect day of B-stock i, the Tth days after its cause day, based on Equation (2), the return for tomorrow follows
R i , E f f e c t = β ^ i , 0 + β ^ i , 1 r i , 1 + β ^ i , 2 r i , 2 + . . . + β ^ i , T i 1 r i , T i 1 + β ^ r ^ M + ε p o o l e d
where r 1 , E f f e c t , r 2 , E f f e c t , . . . , r K , E f f e c t are the given information of R 1 , E f f e c t , R 2 , E f f e c t ,…, R K , E f f e c t and r ^ M is the estimate of R M for tomorrow and ε p o o l e d is normally distributed with mean equal to zero and variance β T i 2 + σ i 2 . The scenarios for tomorrow ( R 1 , E f f e c t , R 2 , E f f e c t ,…, R K , E f f e c t ) are then calculated by generating the realizations of ε p o o l e d .
Only the B-stock whose regression equation is significant and the residuals are normally distributed will be considered. Accordingly, the returns will be generated using available data on a given trading day using the Equation (3). B-stocks whose regression models are not significant will be omitted from the investment pool. Now that we have the return estimates for the investment pool, the next part of the portfolio selection framework is to assign the appropriate probability weights. Since the objective of this study is to have an accurate estimate of the returns of these B-stocks, the authors felt that applying weighting schemes to the return scenarios would influence the back-test results. Thus, to focus on the effects of the proposed estimation technique, the authors decided to consider equally likely scenarios in identifying the optimal portfolios.

2.3. Portfolio Selection Model

Moving forward to the portfolio selection model, the authors just utilized the generic scenario-based optimization model to highlight the contribution of the return estimation technique. For testing purposes, after estimating the return scenarios of the B-stocks using the regression Equation (3), the portfolio optimization model used for this study is the generic scenario-based safety-first portfolio selection model. Suppose that there are n stocks and m scenarios, let p = ( x 1 , x 2 , . . . , x n ) , where i = 1 n x i = 1 , be the portfolio, r p be the return of portfolio p, and E [ r p ] be the expected return of portfolio p. Accordingly, similar in [2] the generic SF portfolio selection model is written as
max E [ r p ]
s . t . P ( r p R L ) γ ,
where R L is the lowest loss level that can be tolerated and γ is a predetermine probability given by the investor as his/her threshold probability of having R L . P ( r p R L ) can be regarded as the downside risk of the portfolio and should not be larger than γ . Therefore, the generic SF portfolio selection model ensures that the resulting portfolio has the maximum expected return and simultaneously limits the probability of loss to a specified threshold probability.
Let scenario j be represented by a row vector of returns such that ( r 1 , j , r 2 , j , . . . , r n , j ) where R i , j is the return of stock i on scenario j. Let P j be the nominal probability weight on scenario j. For scenario j, let r p j denote the return of portfolio p on scenario j and r p j = i = 1 n x i R i j . The scenario-based SF portfolio selection model is written as
max E [ r p ] = j = 1 m r p j P j
s . t . r p j = i = 1 n x i R i j , j = 1 , 2 , . . . , m
R L r p j M ω j , j = 1 , 2 , . . . , m
j = 1 m P j ω j γ
0 x i 1 , ω j   is binary , i = 1 , 2 , . . . , n , j = 1 , 2 , . . . , m
Equation (6) is the objective function that maximizes the total expected return of portfolio p. Equations (8) and (9) are the safety-first constraints that ensure that the P ( r p R L ) will not fall below the threshold probability γ .
Using the estimation technique in Section 2.2 to generate return scenarios for the B-stocks in the small pool and utilizing the generic SF model, this study introduces a new behavioral stock portfolio optimization framework. This framework is tested through back-testing, and the results are shown in the next section.

3. Empirical Results

To test the proposed model, extensive back-tests were done to check the performances of the resulting portfolios against some benchmarks like Morgan Stanley Capital International or MSCI index, portfolio with only MSCI listed stocks, Market (Taiwan Stock Exchange or TWSE), and a respective representative for mutual funds (MFs) and exchange-traded funds (ETFs).

3.1. Data Description

Stock prices, betas, and trading volumes were collected from Taiwan Economic Journal (TEJ) to determine whether a particular stock can be classified as at least one of the 5 types of B-stocks, namely Disposition Effect B-stocks, Over-Reaction B-stocks, Under-Reaction B-stocks, Ostrich Effect B-stocks, and Herding B-stocks. The respective cause-and-effect criteria for each type of B-stocks are shown in Table 2.
Note that a value of p-value < 0.1 for the respective causes of disposition effect and ostrich effect B-stocks denote significant abnormally low trading volume. On the other hand, a value of p-value < 0.1 for the effect of ostrich effect B-stocks denote significant abnormally high trading volume. Please refer to Section 2.1 on how B-stocks are identified.
The data collected is from 1 January 1991 to 30 June 2019. The test period totals 1.5 years (6 quarters) which started from January 2018 to June 2019 (362 trading days). Using the data from 1 January 1991 to 31 December 2017, B-stocks are identified and updated every quarter. The investment pool used is those B-stocks already in their T − 1th day plus the previous quarter’s top 20 MSCI stocks. Overall, in this study, there are 12 portfolios compared with one another. The corresponding information and parameters used by each portfolio are shown in Table 3. Note that the return scenarios for the B-stocks were generated using Equation (3), while single index models were used for the MSCI stocks. Stocks with regression equations that are not significant and or the corresponding residuals are not normally distributed were omitted from the investment pool.
Note that the benchmark ETF (MF) was chosen from 14 (6) other exchange-traded funds (mutual funds) as shown in Table A1 in the Appendix A. The exchange-traded fund (mutual) with the highest cumulative return from the group during the 362 trading days test period is selected as the representative benchmark for the group and denoted as ETF (MF). Collectively, MSCI and B-stock portfolios are denoted as MB portfolios. Similarly, MSCI Only portfolios are denoted as M portfolios. MSCI Taiwan index and Taiwan Stock Exchange Index are denoted as MSCI and Market, respectively.

3.2. Portfolio Performance

For the back-test, following [4], the point of comparison for the portfolio performances is focused on the descriptive statistics of the returns, cumulative returns, and their corresponding distribution. The expectation is that MB portfolios will outperform M portfolios and also benchmarks. Accordingly, the descriptive statistics and distribution of the returns of respective portfolios in Table 3 are shown in Table 4, Table 5, Table 6 and Table 7. For visual comparisons, the cumulative returns of the portfolios are shown in Figure 1, Figure 2, Figure 3, Figure 4, Figure 5 and Figure 6. The comparisons are anchored based on the safety-first parameters used by the portfolios.
Let’s first look at portfolios considering SF parameters of ( R L = −5% & γ = 2%). Table 4 shows 6 portfolios. For comparison purposes, for each criterion of comparison, the portfolio with the best value is given 6 points, followed by 5 points for the 2nd best,…, and the portfolio with the worst value is given 1 point. The portfolio with the highest total points is considered the superior portfolio. In terms of mean return, the order of best portfolio is MB52, M52, ETF, Market, MSCI Index, and MF. Considering the volatility of returns, normally, the standard deviation is desired to be as low as possible, but since the goal of an investor is to ultimately have the most profit. Therefore the high-risk, high-reward concept is applied. Thus, the ranking is MB52, MF, M52, MSCI Index, Market, and ETF. As for the number of positive and negative returns, the order is M52, ETF, MB52, MF, MSCI Index, and Market. The ranking of portfolios in terms of ending cumulative return is M52, M52, ETF, Market, MSCI Index, and MF. Lastly, the number of positive and negative cumulative returns reflects the portfolio order of M52, MB52, ETF, Market, MSCI Index, and MF. Overall, the total points garnered are as follows: MB52(27), M52(26), MSCI Index(11), Market(12), ETF(18), and MF(11). Therefore the order of best portfolio considering SF parameters of ( R L = −5% & γ = 2%) is MB52, M52, ETF, Market, then MSCI Index and MF are tied for 5th best.
Similarly, portfolios using SF parameters of ( R L = −2% & γ = 2%) are also compared based on the order of best portfolio for each comparison criteria. The order of best portfolio for each criterion as shown in Table 5 is as follows: mean return (MB22, M22, ETF, Market, MSCI Index, and MF); standard deviation (MB22, MF, MSCI Index, M22, Market, and ETF); the number of ±return (M22, MB22, ETF, MF, MSCI Index, and Market); ending cumulative return (M22, MB22, ETF, MF, MSCI Index, and Market); and the number of ± cumulative return (MB22 and M22 tied for 1st, ETF, Market, MSCI, and MF). Overall, the total points obtained for each portfolio is as follows: MB22(28), M22(24), MSCI Index(12), Market(12), ETF(17), and MF(11). Thus, the order for best portfolio using ( R L = −2% & γ = 2%) is MB22, M22, ETF, MSCI Index and Market tied for 4th and 5th, and MF.
Following previous comparisons, the order of best portfolio using SF parameters of ( R L = −5% & γ = 5%) based on the respective performances listed in Table 6 are as follows: mean return (MB55, M55, ETF, Market, MSCI Index, and MF); standard deviation (MB55, MF, M55, MSCI Index, Market, and ETF); the number of ± return (M55, ETF, MB55, MF, MSCI Index, and Market); ending cumulative return (MB55, M55, ETF, Market, MSCI Index, and MF); and the number of ± cumulative return (MB55 and M55 tied for 1st, ETF, Market, MSCI Index, and MF). Considering the accumulated comparison points of MB55(27), M55(25), MSCI Index(11), Market(12), ETF(18), and MF(11), the order of best portfolios using SF parameters of ( R L = −5% & γ = 5%) is MB55, M55, ETF, Market, and tied for 5th are MSCI Index and MF.
Lastly, the order of best portfolio using SF parameters of ( R L = −2% & γ = 5%) based on the respective performances listed in Table 7 are as follows: mean return (MB25, M25, ETF, Market, MSCI Index, and MF); standard deviation (MB25, MF, M25, MSCI Index, Market, and ETF); the number of ± return (M25, MB25, ETF, MF, MSCI Index, and Market); ending cumulative return (MB25, M25, ETF, Market, MSCI Index, and MF); and the number of ± cumulative return (MB55 and M55 tied for 1st, ETF, Market, MSCI Index, and MF). Consequently, the order of best portfolios using ( R L = −2% & γ = 5%) is MB25, M25, ETF, Market, and tied for 5th are MSCI Index and MF.
Table 4, Table 5, Table 6 and Table 7 show that MB portfolios can outperform not only the M portfolios but also the MSCI Index, Market and traditional investment options like ETF and MF. Nonetheless, these comparisons are still not enough to conclude the dominance of MB portfolios over their counterparts. Thus, after deleting the outliers, pair-t-tests on the respective return difference of the portfolios are done to provide a more rigorous and accurate performance comparison. The null ( H 0 ) and alternative H 1 hypotheses for the tests are H 0 : There is no return difference between the portfolios.; H 1 : The average pair-return difference is greater than 0. The resulting p-values of the tests are listed in Table 8. Note that the pair-return difference is the return of the row portfolio subtracted by the return of the column portfolio.
Table 8 shows that MB portfolios significantly outperform all other portfolios. In all pairs of MB portfolio & other portfolios, except for MB52 & M52 and MB22 & M22, H 1 is accepted. Moreover, looking at the performance of the pairs MB52 & M52 and MB22 & M22 against the benchmarks, M portfolios have no significant difference from the benchmarks. In contrast, MB portfolios are significant at a 0.05 level. For this reason, it can be said that MB52 (MB22) is better than M52 (M22). Considering the other portfolios, all pair-t-tests failed in rejecting H 0 , except for the pair ETF & Market. In summary, MB portfolios have better portfolio returns than M portfolios and benchmarks, Yuanta Taiwan Financial Fund has better returns than the market, and there is no significant difference in portfolio returns between all other pairs of portfolios. The dominance of MB portfolios over all other portfolios is also clearly seen in the cumulative returns as shown in Figure 1, Figure 2, Figure 3, Figure 4, Figure 5 and Figure 6.
From the performances of the MB portfolios in Figure 1 and Figure 2, it can be observed that MB52 has better cumulative returns than MB22, MB55 has better cumulative returns than MB25, MB55 has better cumulative returns than MB52, and MB25 have better cumulative returns than MB22. These observations imply that when investing in B-stocks, it is somewhat advantageous to be a little bit more risk-seeking because it generates higher profit. In short, in dealing with B-stocks, high-risk, high rewards apply.
Overall with the performances of MB portfolios against its counterparts, the proposed portfolio selection framework can be considered a superior alternative investment option for individual investors. Moreover, it can be a generic investment option for any individual investors.

4. Conclusions

Moreover, given that the 5 types of B-stocks almost have similar considerations for cause and effect, then there might be some correlation between them, which is another point of research altogether. Thus, for this study, we focus on identifying the 5 different types of B-stocks or short-sell B-stocks, then use the corresponding data set to estimate future returns through the proposed estimation technique utilizing the regression model Equation (3).
This study improved upon the existing research on behavioral stock portfolio optimization by providing a simple variation of the basic framework of portfolio selection and a more accurate way of estimating future returns of the investment pool (B-stocks) through regression analysis. Aside from the disposition effect, over-reaction, and under-reaction B-stocks, 2 other types of B-stocks are also considered. These 2 are herding and ostrich effect B-stocks. The respective operational definition (OD) of these irrational behaviors was identified using the available related literature. Another novelty of this work is that after identifying the B-stocks, the returns were estimated and generated through regression analysis. Significant regression equations were used for a quarter and subsequently updated for the following quarter. For testing purposes, on a given trading day, the Tth day (next trading day) returns of B-stocks that were already on their T − 1th day were estimated through scenario generation using the corresponding regression equations. The top 20 MSCI stocks in the same quarter were also estimated using a single index regression model. The B-stocks and top 20 MSCI stocks were then used as the investment pool on that trading day. Assuming equally likely return scenarios, the generic scenario-based safety-first portfolio selection model was applied to identify the optimal portfolio (MB portfolios). To check the performances of the MB portfolios, the resulting portfolios were compared with the index return of the MSCI Index, Market, exchange-traded fund (ETF), and mutual fund (MF). The MB portfolios were also compared to the M portfolios or those safety-first optimal portfolios considering only MSCI stocks. Test results show that MB portfolios are superior to the M portfolios, MSCI Index, Market, ETF, and MF. MB portfolios have better return statistics and higher cumulative returns throughout the test period. In addition, the pair-return differences between the MB portfolios and other portfolios are mostly significant. Thus, it can be concluded that MB portfolios can be an excellent alternative investment option and possibly be a generic portfolio selection framework for individual investors.
This study has a lot of potential extensions to exploit B-stocks or behavioral stocks further. Identification of the operational definitions of other irrational behaviors can increase the types of B-stocks available to individual investors. It is also interesting to study the interconnection between the operational definition of each B-stocks. Other estimation methods can be done to have a more accurate estimation of returns. Scenario generation methods can be applied to produce reliable return scenarios. Weighting techniques can assign scenario probabilities that reflect investors’ risk attitudes. Lastly, the appropriate optimization model can be used to get the corresponding optimal portfolio for individual investors.

Author Contributions

Conceptualization, M.N.Y. and T.T.N.C.; methodology, M.N.Y. and T.T.N.C.; software, M.N.Y. and T.T.N.C.; validation, Y.-H.L., J.F.T.D., Y.T.P., S.F.P. and R.N.; formal analysis, M.N.Y. and T.T.N.C.; investigation, M.N.Y. and T.T.N.C.; resources, M.N.Y. and T.T.N.C.; data curation, M.N.Y. and T.T.N.C.; writing—original draft preparation, M.N.Y. and T.T.N.C.; writing—review and editing, T.T.N.C., Y.-H.L., J.F.T.D., Y.T.P., S.F.P. and R.N.; visualization, M.N.Y. and T.T.N.C.; supervision, Y.-H.L. and J.F.T.D.; project administration, M.N.Y. and T.T.N.C.; funding acquisition, M.N.Y. All authors have read and agreed to the published version of the manuscript.

Funding

This research was funded by Mapúa University Directed Research for Innovation and Value Enhancement (DRIVE).

Institutional Review Board Statement

Not applicable.

Informed Consent Statement

Not applicable.

Data Availability Statement

The data used in this study is available upon request to the corresponding author.

Conflicts of Interest

The authors declare no conflict of interest.

Appendix A

Table A1 shows the exchange-traded funds (ETFs) and mutual funds (MFs) considered for comparisons. The representative ETF(MF) is chosen based on the criteria of having the highest value of cumulative return after the test period, as shown in Figure A1 and Figure A2. For the ETFs(MFs), ETF6(MF3) or Yuanta Taiwan Financial Fund(UPAMC Quality Growth Fund) have the highest cumulative return at the end of the test period, so it was chosen as the representative ETF(MF).
Table A1. List of ETFs and Mutual Funds Considered for Comparisons.
Exchange-Traded FundsMutual Funds
LegendETF CodeETF Name Legend MF Name
ETF10050Taiwan Top 50 ETFMF1Yuanta Mainstream Equity Fund
ETF20051Taiwan Mid-Cap 100 ETFMF2Yuanta Duo Fu Equity Fund
ETF30052Fubon Taiwan Technology ETF FUNDMF3UPAMC Quality Growth Fund
ETF40053Yuanta Taiwan Electronics Tech ETFMF4Jih Sun Jih Sun Fund
ETF50054Yuanta S&P Custom China Play 50 ETFMF5Jih Sun Top Five Fund
ETF60055Yuanta Taiwan Financial Fund ETFMF6Franklin Templeton SinoAm First Fund
ETF70056Yuanta Taiwan Dividend Plus ETF
ETF80057Fubon MSCI Taiwan ETF
ETF90058Fubon Taiwan Eight Industries ETF
ETF100059Taiwan Finance and Insurance Index
ETF11006201Taiwan GreTai 50 ETF
ETF12006203MSCI Taiwan ETF
ETF13006204Sinopac Taiwan TAIEX Index ETF
ETF14006208Fubon Taiwan 50 Index ETF
All the listed exchange-traded Funds and Mutual Funds are Taiwan based. Historical Prices of ETFs are obtained from the Taiwan Economic Journal—TEJ. Historical Prices of MFs are obtained from the Internet web.
Figure A1. Cumulative Return Rate of Exchange-Traded Funds over Test Period.
Mathematics 10 04269 g0a1
Figure A2. Cumulative Return Rate of Mutual Funds over Test Period.
Mathematics 10 04269 g0a2

References

  1. Markowitz, H. Portfolio Selection. J. Financ. 1952, 7, 77–91. [Google Scholar]
  2. Shefrin, H.; Statman, M. Behavioral portfolio theory. J. Financ. Quant. Anal. 2000, 35, 127–151. [Google Scholar] [CrossRef] [Green Version]
  3. Lopes, L. SP/A theory: The role of security, potential and aspiration in risky choice. J. Math. Psychol. 1987, 43, 286–313. [Google Scholar] [CrossRef] [PubMed] [Green Version]
  4. Chang, K.H.; Young, M.N.; Diaz, J.F.T. Portfolio Optimization Utilizing the Framework of Behavioral Portfolio Theory. Int. J. Oper. Res. 2018, 15, 1–13. [Google Scholar]
  5. Antony, A. Behavioral finance and portfolio management: Review of theory and literature. J. Public Aff. 2020, 20, e1996. [Google Scholar] [CrossRef]
  6. Howard, C.T. Behavioral portfolio management. J. Behav. Financ. Econ. Forthcom. 2014. [Google Scholar] [CrossRef]
  7. Barberis, N.; Xiong, W. What drives the disposition effect? An analysis of a long-standing preference-based explanation. J. Financ. 2009, 64, 751–784. [Google Scholar] [CrossRef] [Green Version]
  8. Da Costa, N., Jr.; Mineto, C.; Da Silva, S. Disposition effect and gender. Appl. Econ. Lett. 2008, 15, 411–416. [Google Scholar] [CrossRef] [Green Version]
  9. De Bondt, W.F.; Thaler, R. Does the stock market overreact? J. Financ. 1985, 40, 793–805. [Google Scholar] [CrossRef]
  10. Gunaratne, P.; Yonesawa, Y. Return reversals in the Tokyo Stock Exchange: A test of stock market overreaction. Jpn. World Econ. 1997, 9, 363–384. [Google Scholar] [CrossRef]
  11. Michaely, R.; Thaler, R.H.; Womack, K.L. Price reactions to dividend initiations and omissions: Overreaction or drift? J. Financ. 1995, 50, 573–608. [Google Scholar] [CrossRef]
  12. Shefrin, H.; Statman, M. The disposition to sell winners too early and ride losers too long: Theory and evidence. J. Financ. 1985, 40, 777–790. [Google Scholar] [CrossRef]
  13. De Bondt, W.F.; Thaler, R.H. Further evidence on investor overreaction and stock market seasonality. J. Financ. 1987, 42, 557–581. [Google Scholar] [CrossRef]
  14. Bowman, R.G.; Iverson, D. Short-run overreaction in the New Zealand stock market. Pac.-Basin Financ. J. 1998, 6, 475–491. [Google Scholar] [CrossRef]
  15. Otchere, I.; Chan, J. Short-term overreaction in the Hong Kong stock market: Can a contrarian trading strategy beat the market? J. Behav. Financ. 2003, 4, 157–171. [Google Scholar] [CrossRef]
  16. Ma, Y.; Tang, A.P.; Hasan, T. The stock price overreaction effect: Evidence on Nasdaq stocks. Q. J. Bus. Econ. 2005, 44, 113–127. [Google Scholar]
  17. Madura, J.; Richie, N. Overreaction of exchange-traded funds during the bubble of 1998–2002. In Handbook of Behavioral Finance; Edward Elgar Publishing: Cheltenham, UK, 2010. [Google Scholar]
  18. Massey, C.; Wu, G. Understanding under-and over-reaction. Psychol. Econ. Decis. 2004, 2, 15–29. [Google Scholar]
  19. Bernard, V.L.; Thomas, J.K. Evidence that stock prices do not fully reflect the implications of current earnings for future earnings. J. Account. Econ. 1990, 13, 305–340. [Google Scholar] [CrossRef] [Green Version]
  20. Abarbanell, J.S.; Bernard, V.L. Tests of analysts’ overreaction/underreaction to earnings information as an explanation for anomalous stock price behavior. J. Financ. 1992, 47, 1181–1207. [Google Scholar] [CrossRef]
  21. Ikenberry, D.; Lakonishok, J.; Vermaelen, T. Market underreaction to open market share repurchases. J. Financ. Econ. 1995, 39, 181–208. [Google Scholar] [CrossRef] [Green Version]
  22. Frankfurter, G.M.; McGoun, E.G. Resistance is futile: The assimilation of behavioral finance. J. Econ. Behav. Organ. 2002, 48, 375–389. [Google Scholar] [CrossRef]
  23. Galai, D.; Sade, O. The “ostrich effect” and the relationship between the liquidity and the yields of financial assets. J. Bus. 2006, 79, 2741–2759. [Google Scholar] [CrossRef]
  24. Karlsson, N.; Loewenstein, G.; Seppi, D. The ostrich effect: Selective attention to information. J. Risk Uncertain. 2009, 38, 95–115. [Google Scholar] [CrossRef]
  25. Webb, T.L.; Chang, B.P.; Benn, Y. ‘The ostrich problem’: Motivated avoidance or rejection of information about goal progress. Soc. Personal. Psychol. Compass 2013, 7, 794–807. [Google Scholar] [CrossRef]
  26. Kahn, W.A. The Ostrich Effect: Solving Destructive Patterns at Work; Routledge: London, UK, 2015. [Google Scholar]
  27. Panidi, K. Ostrich Effect in Health Care Decisions: Theory and Empirical Evidence; SSRN: Rochester, NY, USA, 2015. [Google Scholar]
  28. Banerjee, A.V. A simple model of herd behavior. Q. J. Econ. 1992, 107, 797–817. [Google Scholar] [CrossRef] [Green Version]
  29. Devenow, A.; Welch, I. Rational herding in financial economics. Eur. Econ. Rev. 1996, 40, 603–615. [Google Scholar] [CrossRef]
  30. Simonsohn, U.; Ariely, D. When rational sellers face nonrational buyers: Evidence from herding on eBay. Manag. Sci. 2008, 54, 1624–1637. [Google Scholar] [CrossRef] [Green Version]
  31. Bikhchandani, S.; Hirshleifer, D.; Welch, I. A theory of fads, fashion, custom, and cultural change as informational cascades. J. Political Econ. 1992, 100, 992–1026. [Google Scholar] [CrossRef]
  32. Christie, W.G.; Huang, R.D. Following the pied piper: Do individual returns herd around the market? Financ. Anal. J. 1995, 51, 31–37. [Google Scholar] [CrossRef]
  33. Chang, E.C.; Cheng, J.W.; Khorana, A. An examination of herd behavior in equity markets: An international perspective. J. Bank. Financ. 2000, 24, 1651–1679. [Google Scholar] [CrossRef]
  34. Durukan, M.B.; Özsu, H.H.; Ergun, Z.C. Financial crisis and herd behavior: Evidence from the Borsa Istanbul. In Handbook of Investors’ Behavior during Financial Crises; Elsevier: Amsterdam, The Netherlands, 2017; pp. 203–217. [Google Scholar]
  35. Chang, K.H.; Young, M.N.; Hildawa, M.I.; Santos, I.J.R.; Pan, C.H. Portfolio selection problem considering behavioral stocks. In Proceedings of the World Congress on Engineering, London, UK, 1–3 July 2015; Volume 2, pp. 1–3. [Google Scholar]
  36. Chang, K.H.; Young, M.N.; Wu, K.L. Portfolio selection problem considering behavioral stocks under holding Period. Int. J. Model. Optim. 2016, 6, 219–224. [Google Scholar] [CrossRef] [Green Version]
  37. Chang, K.H.; Young, M.N.; Liu, C.C.; Chung, H.P. Behavioral Stock Portfolio Optimization through Short-Selling. Int. J. Model. Optim. 2018, 8, 125–130. [Google Scholar] [CrossRef] [Green Version]
  38. Chang, K.H.; Young, M.N. Behavioral stock portfolio optimization considering holding periods of B-stocks with short-selling. Comput. Oper. Res. 2019, 112, 104773. [Google Scholar] [CrossRef]
  39. Chang, K.H.; Young, M.N. Portfolios Optimizations of Behavioral Stocks with Perception Probability Weightings. Ann. Econ. Financ. 2019, 20, 817–845. [Google Scholar]
  40. Polman, D. The Ostrich Effect on the Fixed Income Market. Master’s Thesis, Erasmus University Rotterdam, Rotterdam, The Netherlands, 2019. [Google Scholar]
Figure 1. Cumulative Return Rate of Portfolios over Test Period.
Mathematics 10 04269 g001
Figure 2. Cumulative Return Rate of MB Portfolios vs Benchmarks over Test Period.
Mathematics 10 04269 g002
Figure 3. Cumulative Return Rate of MB52 vs M52 over Test Period.
Mathematics 10 04269 g003
Figure 4. Cumulative Return Rate of MB22 vs M22 over Test Period.
Mathematics 10 04269 g004
Figure 5. Cumulative Return Rate of MB55 vs M55 over Test Period.
Mathematics 10 04269 g005
Figure 6. Cumulative Return Rate of MB25 vs M25 over Test Period.
Mathematics 10 04269 g006
Table 1. Operational Definitions: Cause-and-Effect Relations.
BehaviorTypeCauseEffect
Disposition EffectB-stocksDisposition effect loser (combination of R G and low A V ¯ )+CAR
Short-sell B-stocksDisposition effect winner (combination of + R G and high A V ¯ )−CAR
Over-reactionB-stockshigh − price change (return rate)+CAR
Short-sell B-stockshigh + price change (return rate)−CAR
Under-reactionB-stockshigh + price change (return rate)+CAR
Short-sell B-stockshigh − price change (return rate)−CAR
Ostrich EffectB-stocksostrich effect loser (combination of R G and low A V ¯ )+CAR and high A V ¯
Short-sell B-stocksostrich effect winner (combination of + R G and high A V ¯ )−CAR and low A V ¯
HerdingB-stockshigh A V ¯ (abnormal average volume)+CAR
Short-sell B-stockshigh A V ¯ (abnormal average volume)−CAR
Table 2. B-stocks Cause-and-Effect Criteria.
B-Stock TypeCauseEffect
disposition-effect R G 10 % & p-value < 0.1 C A R + 1 %
over-reaction R 5 % C A R + 1 %
under-reaction R 5 % C A R + 1 %
ostrich-effect R G 10 % & p-value < 0.1 C A R + 1 % & p-value < 0.1
herdingp-value < 0.1 C A R + 1 %
R, RG, CAR, and p-value respectively denotes return, geometric return, cumulative abnormal return, and p-value of abnormal volume.
Table 3. Portfolios and Benchmarks Information.
Portfolio NameCodeModelInvestment Pool
MSCI and B-stocks (−5% & 2%)MB52SF ( R L = 5 % & γ = 2%)B-stocks and MSCI Stocks
MSCI and B-stocks (−2% & 2%)MB22SF ( R L = 2 % & γ = 2%)B-stocks and MSCI Stocks
MSCI and B-stocks (−5% & 5%)MB55SF ( R L = 5 % & γ = 5%)B-stocks and MSCI Stocks
MSCI and B-stocks (−2% & 5%)MB25SF ( R L = 2 % & γ = 5%)B-stocks and MSCI Stocks
MSCI Only (−5% & 2%)M52SF ( R L = 5 % & γ = 2%)MSCI Stocks
MSCI Only (−2% & 2%)M22SF ( R L = 2 % & γ = 2%)MSCI Stocks
MSCI Only (−5% & 5%)M55SF ( R L = 5 % & γ = 5%)MSCI Stocks
MSCI Only (−2% & 5%)M25SF ( R L = 2 % & γ = 5%)MSCI Stocks
MSCI Taiwan IndexMSCIIndex ReturnMSCI Index
Taiwan Stock ExchangeMarketIndex ReturnMarket Index
Yuanta Taiwan Financial FundETFIndex ReturnETF Index
UPAMC Quality Growth FundMFIndex ReturnMF Index
Table 4. Return Statistics of Portfolios using SF ( R L = −5% & γ = 2%).
362 Trading Days StatisticsMB52M52MSCI IndexMarketETFMF
Mean Return0.0028970.0008060.0000590.0000640.0004430.000057
Standard Deviation0.02160.01160.01030.00910.00710.0118
Number of Positive Returns216227200196219206
Number of Negative Returns146135162166143156
Ending Cumulative Return1.62400.30640.00220.00820.1634−0.0048
Number of Postive Cumulative Returns361362197204358154
Number of Negative Cumulative Returns101651584208
Table 5. Return Statistics of Portfolios using SF ( R L = −2% & γ = 2%).
362 Trading Days StatisticsMB22M22MSCI IndexMarketETFMF
Mean Return0.0019550.0008290.0000590.0000640.0004430.000057
Standard Deviation0.01370.01000.01030.00910.00710.0118
Number of Positive Returns228235200196219206
Number of Negative Returns134127162166143156
Ending Cumulative Return0.96070.32590.00220.00820.1634−0.0048
Number of Positive Cumulative Returns362362197204358154
Number of Negative Cumulative Returns001651584208
Table 6. Return Statistics of Portfolios using SF ( R L = −5% & γ = 5%).
362 Trading Days StatisticsMB55M55MSCI IndexMarketETFMF
Mean Return0.0030230.0008230.0000590.0000640.0004430.000057
Standard Deviation0.02190.01150.01030.00910.00710.0118
Number of Positive Returns218227200196219206
Number of Negative Returns144135162166143156
Ending Cumulative Return1.73850.31510.00220.00820.1634−0.0048
Number of Positive Cumulative Returns362362197204358154
Number of Negative Cumulative Returns001651584208
Table 7. Return Statistics of Portfolios using SF ( R L = −2% & γ = 5%).
362 Trading Days StatisticsMB25M25MSCI IndexMarketETFMF
Mean Return0.0023740.0007290.0000590.0000640.0004430.000057
Standard Deviation0.01690.01100.01030.00910.00710.0118
Number of Positive Returns222225200196219206
Number of Negative Returns140137162166143156
Ending Cumulative Return1.24130.27410.00220.00820.1634−0.0048
Number of Positive Cumulative Returns362362197204358154
Number of Negative Cumulative Returns001651584208
Table 8. Pair-T Tests: Return Difference on 362 Trading days.
MSCI ONLYMSCI IndexMarketETFMF
MSCI and B-stocks (−5% and 2%)0.2000.024 **0.021 **0.098 *0.035 **
MSCI ONLY (−5% and 2%) 0.3400.4070.4790.363
MSCI and B-stocks (−2% and 2%)0.1550.011 **0.010 **0.042 **0.011 **
MSCI ONLY (−2% and 2%) 0.2180.1850.4760.259
MSCI and B-stocks (−5% and 5%)0.071 *0.012 **0.010 **0.066 *0.019 **
MSCI ONLY (−5% and 5%) 0.3300.3950.4650.353
MSCI and B-stocks (−2% and 5%)0.019 **0.018 **0.021 **0.026 **0.008 ***
MSCI ONLY (−2% and 5%) 0.4560.3770.6880.396
MSCI Index 0.4310.8990.512
Market 0.569 0.9320.510
Yuanta Taiwan Financial Fund 0.1010.068 * 0.283
UPAMC Quality Growth Fund 0.4880.4900.717
*, ** and *** respectively denote significance at 0.1, 0.05 and 0.01 levels.
Publisher’s Note: MDPI stays neutral with regard to jurisdictional claims in published maps and institutional affiliations.

