 India by night. Photo: Shutterstock.com
In India and across the world, COVID-19 has disrupted economic activity. Quantifying this disruption is challenging. Traditional national account estimates, the official government measure for economic activity, are not very helpful for that. To monitor economic activity in times like these, one needs instead measures that are available at higher frequency and higher spatial granularity- for example at the district level.
In India, the amount of electricity used (measured as total consumption) and the intensity of lights in the evening (measured as lights per area) are useful proxy indicators. Electricity consumption is measured daily at the state-level and changes reveal information about the economy. Similarly, monthly nighttime light intensity, observed by satellites from outer space, contains information about economic activity at high spatial granularity and has hence been used in a wide array of economic studies. Both proxy indicators are positively related to economic activity in India.
The two proxy indicators fulfill different purposes and complement each other. Electricity consumption data is available at higher frequency and has a stronger relationship with economic activity. Nighttime lights data, on the other hand, is available at a much higher spatial granularity.
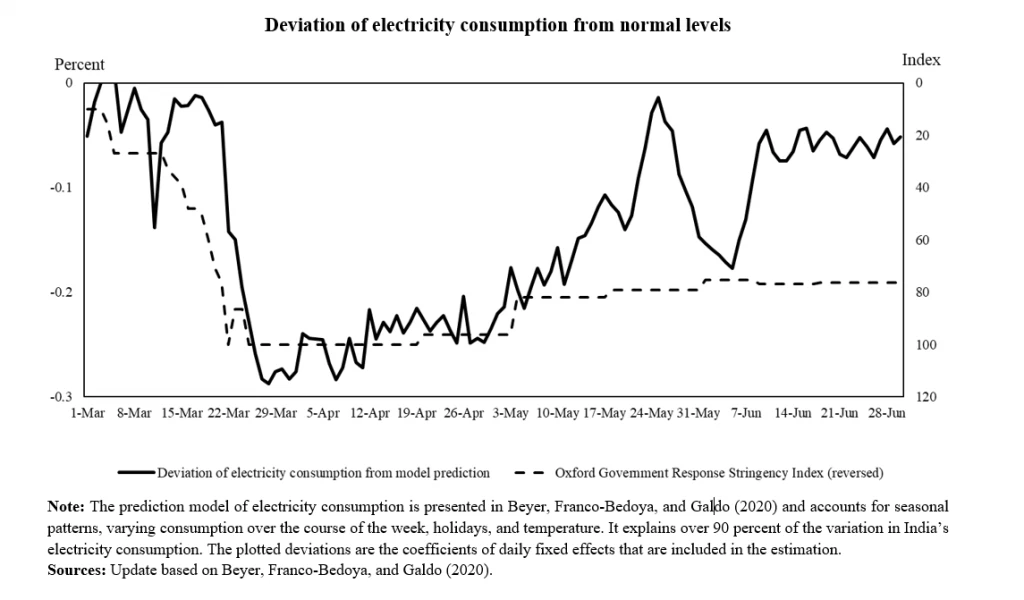
Electricity consumption has declined strongly after the national lockdown was enacted. We compare the daily electricity consumption during the lockdown to the predictions of a consumption model that, among others, considers seasonal patterns, the temperature, and holidays. The first meaningful deviation from normal levels, i.e. from the prediction of the consumption model, was on March 22, when the India observed a 14-hour long curfew. On that day, the Government of India ordered a lockdown in all major cities and 75 districts with COVID-19 cases.
Electricity consumption dropped further over the next few days and especially after the national lockdown was implemented on March 25. It was nearly 30 percent below normal levels at the end of March and remained a quarter below normal levels in April. In May, when some restrictions were eased, electricity consumption was on average 14 percent below normal and in June it was still 8 percent below normal. Electricity consumption seems to have stabilized at around 5 percent below normal at the end of June. We update our estimates every two weeks and make them publicly available.
Lower electricity consumption implies lower economic activity. The two are closely linked and with the help of some assumptions it is possible to provide an approximation of the economic costs that have so far occurred from COVID-19. In the past, a unit of additional economic activity in India has been associated with 1.3 units additional electricity consumption. If we add up the daily losses in economic activity using that relationship, depending on exactly how we count the days, the economic impact has already been between $160 billion (5.6 percent of GDP) and $175 billion (6.0 percent of GDP).

The economic disruption is also visible from outer space: India has become darker over the last four months. While Indian districts are on average getting brighter over time, luminosity in evening hours has declined since March. Nighttime light intensity can be used to examine the effects of COVID-19 at the district level. In April, for example, nighttime light intensity declined in more than two thirds of the districts and the average decline was over 10 percent. Interestingly, the more COVID-19 cases are recorded in a district, the larger is the decline in nighttime light intensity. This suggests that if risks increase, people either follow restrictions more closely or undertake additional voluntary measures. This has important implications for the economic impact of easing restrictions. If the risks of an infection are not declining, people may not be willing to change their behavior again.
New data sources are needed to assess the economic situation across the world. In India, daily electricity consumption and monthly nighttime light intensity provide interesting insights. Both track the recent economic disruption and ongoing recovery and provide useful insights for policy makers and the general public. We discuss these two proxy indicators in more detail in our new World Bank Policy Research Working Paper and the upcoming India Development Update.


Join the Conversation